September 2026 Recap: Down 28.9% This Year, and What I Changed
September closed at +2.69%. The year is down 28.9% after a 46.8% drawdown from May. Monthly returns vs the S&P 500, what went wrong, and what I changed.

September closed at +2.69%, the first positive month since May. The year is still down 28.9%, while the S&P 500 is up 11.8%.
This is my first monthly recap on the blog, so I will start with the whole year. I publish the losing months the same way as the winning ones. A track record only means something if you can see all of it.
The year so far
The year had two halves. By the end of May the strategy was up 30.1%, against 10.7% for the S&P 500. Then three losing months in a row took it to down 30.8% by the end of August.
| Month | Strategy | S&P 500 |
|---|---|---|
| January | +8.45% | +1.37% |
| February | −1.72% | −0.87% |
| March | −1.44% | −5.09% |
| April | +11.02% | +10.42% |
| May | +11.51% | +5.15% |
| June | −20.99% | −1.06% |
| July | −20.08% | −0.13% |
| August | −15.68% | +2.62% |
| September | +2.69% | −0.45% |
| Year to date | −28.90% | +11.78% |
From the May high to the August low, the drawdown was 46.8%.
All figures are time weighted returns from monthly brokerage statements, so deposits and withdrawals do not affect them. 2026 figures are unaudited. S&P 500 figures are price returns.
What went wrong in June and July
The market changed, and I did not change fast enough. Since spring it has moved in fast, sharp swings with only short stretches of clean trend. My risk rules and option structures were built for the slower trends of 2025, when I could ride swings like these.
I made three mistakes:
- Too many positions. I had more than 20 open at once. When the market turned, I could not adjust them all in time.
- The wrong structures for the move. In the April and May rally, many ideas were right, but the spreads I used capped the gains.
- Holding winners too long. In a fast market, a profit that is not booked can disappear in days. I waited for full targets instead of taking profits along the way.
The research held up. The execution did not fit the market.
What I changed
I put new risk rules in place in August:
- 14 positions at most. Fewer ideas, each one easier to watch and adjust.
- Structure chosen for each thesis. I calculate the structure for the specific move and time window I expect, instead of using the same spread by habit.
- Enter in chunks. I build a position in parts, so one bad entry does not set the whole cost.
- Book profits gradually. I take partial profits as a trade works, instead of waiting for the full target.
August was still a loss of 15.7%. Most of that loss came from positions opened before the new rules, which were still running. September is the first month run mostly under the new rules.
September in detail
September was a small gain, and it came from open positions.
What worked
- T-Mobile (TMUS), bearish put spread. Competition in wireless is fierce, and TMUS traded at a premium valuation without a clear moat. It reported weak new account growth, and Starlink's product is a growing threat.
- Microsoft (MSFT), long calls. The stock sold off on conservative Azure results. I saw it as an overreaction: Azure was held back by supply constraints, not demand. I bet on mean reversion at the next report. Azure growth beat estimates.
- Old Dominion Freight (ODFL), bearish put spread. Freight prices rose this year, as fewer truck drivers met the new DMV requirements. That tailwind faded. Cass industry data showed flat to lower freight volumes, while fuel and insurance costs rose. The stock still traded near the top of its valuation range.
What did not work
- Applied Digital (APLD), long calls. The largest realized loss of the month. I rolled the calls to a later expiry as the October date came close.
- Fastly (FSLY), Aehr Test Systems (AEHR) and Impinj (PI), long puts. These bearish bets expired worthless on September 18. The timing was wrong: the stocks did not fall before expiry.
The lesson of the month: my shorts were concentrated in AI related names, and AI stocks held up better than the rest of the market. Shorts in industrials or consumer discretionary would have worked better.
How I am positioned now
I am leaning bullish going into October. My view at the end of September:
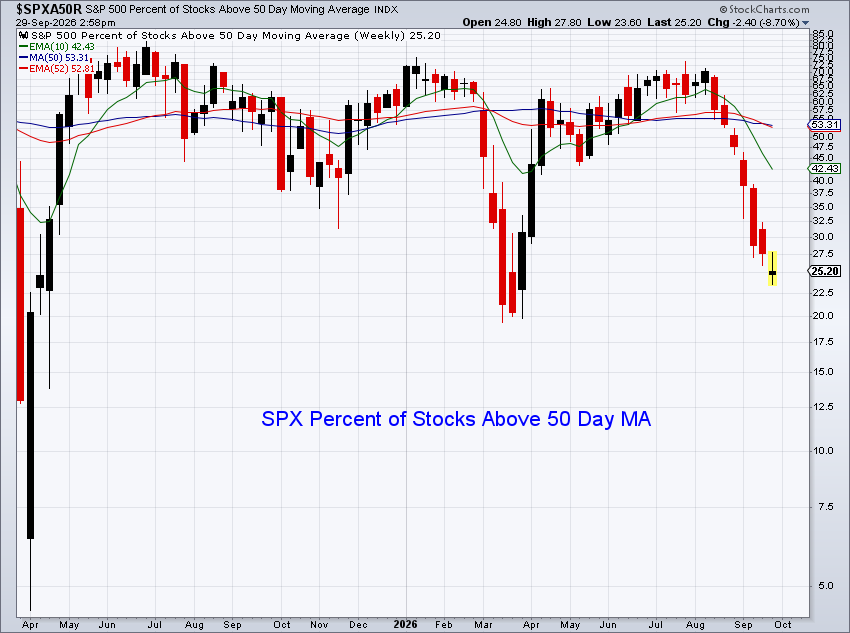
- Most stocks have already corrected. The S&P 500 traded near its highs, while only about 25% of its stocks were above their 50 day moving average. The index held up while most of its members fell. That kind of washout is usually where buying opportunities start.
- Seasonality turns. September is historically the weakest month of the year. October through December is historically the strongest.
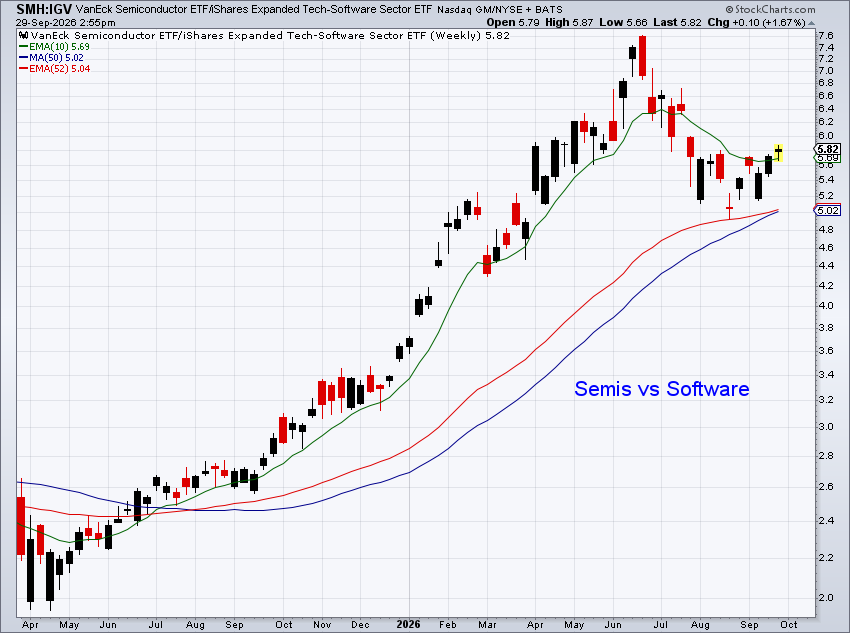
- Semis over software. Micron's report on September 30 was the test for semiconductors, the backbone of this market. If it beat, long semis (SMH) against short software (IGV) is a spread I want in the book, through the ETFs or single stocks. Some software names will keep growing either way, so I am selective on that side.
- Hedges stay on. Some short positions and long volatility protect the book if the semis story breaks.
- The bigger picture. Micron sets the next few days. The next few months depend on macro and the November elections, and a lot of pessimism is already priced in. With the economy still strong, I see this as a good time to own equities.
Update: Micron's report was strong and validated the bull case. I am adding risk into year end.
I share new positions on X as I open them: @rakhmatov_i.
2025 for context
In 2025 the same method returned 97.71%, against 19.22% for the S&P 500, verified by a U.S. licensed CPA. It had nine winning months out of twelve, and its deepest drawdown was 20.3%, in August and September, which it recovered by November.
So the method can work, and 2026 shows how it fails when the market changes faster than the risk rules. Both years are on the Track Record page, month by month, and the eight steps are on the Method page.
I will publish a recap like this one every month, good or bad. If you want to see how the Method works on a live trade, book a free walkthrough.
Past performance is not indicative of future results. This post is educational and is not investment advice.