Sortino, Sharpe and Calmar Ratios: How I Measure Returns
How I calculate my Sharpe, Sortino and Calmar ratios, step by step, from real monthly returns. Including the mistake I made, and what the same ratios show in a bad year.

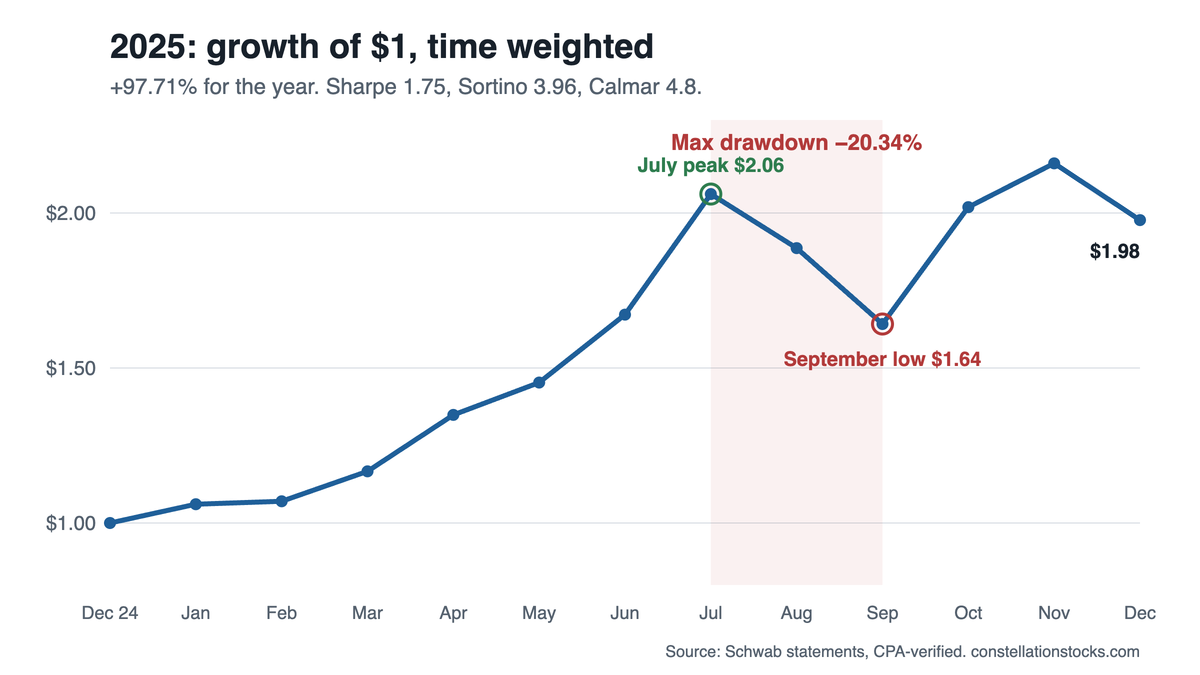
My Track Record page shows a Sharpe ratio of 1.75, a Sortino ratio of 3.96 and a Calmar ratio of 4.8 for 2025. This post shows how each number is calculated, step by step, from my real monthly returns. You can copy the formulas and run them on your own account.
All numbers below come from my 2025 Schwab statements. The full year is verified by a U.S. licensed CPA.
The data: 12 monthly returns
Every metric in this post starts from the same 12 numbers, my 2025 monthly returns:
| Month | Return | Month | Return |
|---|---|---|---|
| January | +6.06% | July | +23.26% |
| February | +0.89% | August | −8.46% |
| March | +9.03% | September | −12.98% |
| April | +15.60% | October | +22.97% |
| May | +7.74% | November | +6.99% |
| June | +15.08% | December | −8.47% |
Average monthly return: 6.48%. Compounded over the year: +97.71%.
Why time weighted return comes first
Before any ratio, you need a return that is not distorted by money moving in and out of the account.
In 2025 I withdrew about $130,000 from the account and deposited about $2,000. The account started the year at $196,502 and ended at $225,715. A simple "end value versus start value" says +14.9%. That number is wrong, because it counts withdrawals as losses.
The time weighted rate of return (TWRR) fixes this. You calculate each month's return on the money that was actually invested that month, then chain the months together:
(1 + 6.06%) × (1 + 0.89%) × ... × (1 − 8.47%) − 1 = +97.71%
Time weighted return is the standard for fund managers because it measures the strategy, not the timing of deposits and withdrawals. It is also the number my CPA verified.
How to calculate the Sharpe ratio
The Sharpe ratio measures return above cash, per unit of total volatility. Higher is better.
Formula (monthly data, annualized):
Sharpe = (average monthly return − risk-free rate ÷ 12) ÷ standard deviation of monthly returns × √12
My 2025 numbers:
- Average monthly return: 6.48%
- Risk-free rate: 5% a year, so 0.42% a month
- Excess return: 6.48% − 0.42% = 6.06%
- Standard deviation of the 12 monthly returns: 11.97%
- Monthly Sharpe: 6.06% ÷ 11.97% = 0.506
- Annualized: 0.506 × √12 = 1.75
The √12 converts a monthly ratio into an annual one. Returns grow with time, and volatility grows with the square root of time, so the ratio scales by √12.
What is a good Sharpe ratio?
A common rule of thumb:
- Below 1.0: weak. The return does not pay well for the swings.
- 1.0 to 2.0: good.
- Above 2.0: very good, and rare over long periods.
- Above 3.0: usually a short sample or a strategy with hidden risk.
The S&P 500 has averaged roughly 0.4 to 0.6 over long periods. One year of data is a short sample, so treat any single-year Sharpe ratio with care, including mine.
How to calculate the Sortino ratio
The Sortino ratio is the Sharpe ratio with one change: only bad volatility counts as risk.
The Sharpe ratio punishes a +23% month the same way it punishes a −13% month, because both make the standard deviation bigger. Most investors do not mind the +23% month. The Sortino ratio replaces the standard deviation with the downside deviation, which only looks at months below the target return.
Formula:
Sortino = (average monthly return − risk-free rate ÷ 12) ÷ downside deviation × √12
Downside deviation = √( average over all 12 months of min(0, monthly return − risk-free rate ÷ 12)² )
Step by step with my 2025 numbers:
- Target return: the risk-free rate, 0.42% a month.
- Find the months below target. Only three: August (−8.46%), September (−12.98%) and December (−8.47%). Every other month counts as zero.
- Shortfall for each: −8.88%, −13.40% and −8.89%.
- Square them: 78.8, 179.5 and 79.0.
- Add them up (337.2) and divide by all 12 months, not by 3: 28.1.
- Square root: downside deviation = 5.30% a month.
- Monthly Sortino: 6.06% ÷ 5.30% = 1.143
- Annualized: 1.143 × √12 = 3.96
Step 5 is where most calculations go wrong. You divide by the total number of months, because the months above target are part of the record. They just contribute zero downside.
What is a good Sortino ratio?
Because it ignores upside swings, the Sortino ratio is usually higher than the Sharpe ratio for the same returns. A rough guide:
- Below 1.0: weak.
- 1.0 to 2.0: good.
- Above 2.0: very good.
Sharpe vs Sortino: why mine are so different
My Sortino (3.96) is more than twice my Sharpe (1.75). That gap tells you something about the return pattern.
Most of the 2025 volatility came from big winning months (+15.60%, +15.08%, +23.26%, +22.97%), not from big losses. Sharpe counts those months as risk. Sortino does not.
A strategy with frequent small gains and rare large losses shows the opposite pattern, a Sortino close to or even below its Sharpe. Selling options often looks like that. So comparing the two ratios is a quick way to see the shape of the risk.
What is maximum drawdown?
Maximum drawdown is the largest fall from a peak to a low, before a new peak is reached.
Using the compounded monthly returns, my 2025 peak came at the end of July. August (−8.46%) and September (−12.98%) took the account down:
(1 − 8.46%) × (1 − 12.98%) − 1 = −20.34%
October and November recovered it. The account was at a new high by the end of November, two months after the low.
Drawdown matters because it is the number you have to sit through. Honest disclosure: in 2026 the drawdown is much larger. At the end of October 2026 the account was 49.61% below its May 2026 peak. Both numbers are on the Track Record page, month by month.
What is the Calmar ratio?
The Calmar ratio compares the annual return with the maximum drawdown:
Calmar = annual return ÷ |maximum drawdown| = 97.71% ÷ 20.34% = 4.8
It answers a simple question: how many units of return did each unit of the worst pain buy? Above 1.0 is solid. Above 3.0 is rare.
The usual definition uses the last three years. With one full year, my Calmar ratio is a short sample and will move a lot, especially with the 2026 drawdown included.
Sharpe vs Sortino vs Calmar: which one to use
Each ratio puts a different kind of risk under the return:
| Sharpe ratio | Sortino ratio | Calmar ratio | |
|---|---|---|---|
| What counts as risk | All volatility, up and down | Only months below the target | The worst peak to low fall |
| Best for | Comparing steady strategies | Strategies with big winning months | Knowing what you have to sit through |
| Weak spot | Punishes big gains | Needs several losing months to be reliable | One bad stretch decides it |
| My 2025 | 1.75 | 3.96 | 4.8 |
No single ratio is enough. Read them together, next to the monthly returns they come from.
What is profit factor, and why win rate matters less
These two come from closed trades, not from monthly returns.
Profit factor = gross gains ÷ gross losses on closed trades. Mine was 1.4 in 2025: for every $1 lost on losing trades, the winners made $1.40.
Win rate was about 48% across 169 trades in 94 tickers. Fewer than half the trades won.
The two numbers together explain the return. It did not come from being right more often. It came from winners being bigger than losers, and from cutting losers on a rule. A profit factor above 1.0 with a win rate below 50% is a normal pattern for strategies that buy options.
What does correlation to the S&P 500 show?
Correlation measures how closely my monthly returns moved with the index, on a scale from −1 to 1. Mine was 0.03 in 2025, close to zero. My best months did not line up with the market's best months. The returns came from individual stock selection, long and short, not from riding the market.
Other ratios you may see
- Information ratio: return above a benchmark, divided by how much your returns differ from that benchmark month to month (tracking error). Useful when a fund tries to beat a specific index.
- Treynor ratio: return above cash, divided by beta, so risk is only the market exposure. With a correlation of 0.03, my beta is close to zero and the Treynor ratio has no meaning for my book.
- Omega ratio: all gains above a threshold divided by all losses below it, using the whole spread of returns instead of one volatility number.
- MAR ratio: the Calmar idea over the full history since inception instead of three years.
Monthly or daily data?
I use monthly returns for three reasons. My brokerage statements and the CPA verification are monthly. Option prices between trades are noisy, because bid and ask spreads move the account value day to day without any real change in the positions. And most fund reports use monthly data, so the numbers compare like for like.
Daily data gives you more data points, so the ratios settle faster. Annualize with √252 instead of √12. The two methods give different numbers for the same account, so always say which one you used.
What the same ratios show in a bad year: my 2026
Ratios are easy to publish in a good year. Here are the same formulas on my 2026 returns, ten months through October (unaudited):
| Metric | 2025 | 2026 through October |
|---|---|---|
| Return | +97.71% | −34.47% |
| Average monthly return | +6.48% | −3.41% |
| Standard deviation (monthly) | 11.97% | 12.35% |
| Downside deviation (monthly) | 5.30% | 11.02% |
| Sharpe ratio | 1.75 | −1.07 |
| Sortino ratio | 3.96 | −1.20 |
| Maximum drawdown | −20.34% | −49.61% |
| Calmar ratio (return ÷ drawdown) | 4.8 | −0.69 |
Look at the downside deviation. In 2025 it was less than half the standard deviation, because the big months were winners. In 2026 it is almost equal to the standard deviation, because the big months were losers: six of the ten months were below target. In 2025 my Sortino ratio was 2.3 times my Sharpe ratio. In 2026 it is only 1.1 times. When the downside deviation gets close to the standard deviation, the losses are doing the swinging. That signal showed up in the ratios well before the year was over.
Volatility was about the same in both years. What changed was its direction. That is the most useful lesson these ratios taught me.
The mistake I made, and the common ones
When I first published these numbers, the Track Record page showed a Sharpe ratio of 2.24 and a Sortino ratio of 5.25. While preparing my first Every Trade I Made video, I rechecked the math and found the method was wrong. I updated the page to 1.75 and 3.96.
Here is what went wrong, and the other mistakes I see most often.
1. Mixing a compounded return with an arithmetic volatility. My original Sharpe used the annual compounded return (97.71%) minus the risk-free rate, divided by annualized volatility (41.46%). That gives 2.24.
Compounding inflates the annual return when monthly returns are large, so the ratio looks better than it is. The standard method uses the average monthly return, as above.
2. Using population instead of sample standard deviation. With 12 months, the population version (STDEV.P in Excel) gives a Sharpe of 1.83 instead of 1.75. Use the sample version (STDEV or STDEV.S).
3. Dividing downside deviation by the losing months only. In my case that gives a downside deviation of 10.6% instead of 5.3%, and a Sortino ratio about half the correct value.
4. Ignoring deposits and withdrawals. Use time weighted monthly returns. Account value changes are not returns.
5. Trusting a short history. Twelve months is enough to calculate the ratios, not enough to rely on them. One more bad year changes everything, as my 2026 shows.
Calculate your own: spreadsheet formulas
Put your monthly returns in cells A2:A13 (as decimals, e.g. 0.0606) and the annual risk-free rate in B1 (e.g. 0.05).
- Average monthly return:
=AVERAGE(A2:A13) - Sharpe ratio:
=(AVERAGE(A2:A13)-B1/12)/STDEV(A2:A13)*SQRT(12) - Sortino ratio:
=(AVERAGE(A2:A13)-B1/12)/SQRT(SUMPRODUCT((A2:A13-B1/12<0)*(A2:A13-B1/12)^2)/12)*SQRT(12) - Compounded return (TWRR):
=PRODUCT(1+A2:A13)-1 - Calmar ratio: compounded return ÷ the absolute value of your maximum drawdown
These work in Excel and Google Sheets. For more than 12 months, change the range and replace the 12 in the Sortino formula with your number of months.
FAQ
Can the Sharpe ratio be negative?
Yes. If the average return is below the risk-free rate, the top of the formula is negative, and so is the ratio. It means cash in Treasury bills would have done better, with no swings at all.
Is the Sharpe or the Sortino ratio better?
Neither is better; they answer different questions. Sharpe treats all volatility as risk. Sortino only counts losses below a target. Use both: the gap between them shows whether your volatility comes from big gains or from big losses.
How do you annualize a monthly Sharpe ratio?
Multiply the monthly Sharpe ratio by √12, about 3.46. For daily data use √252, and for weekly data √52.
What risk-free rate should you use?
Use the yield on short-term Treasury bills for the period you measure. I use 5% for 2025, a little above that year's 3-month T-bill yields, which makes my ratios slightly conservative. Write the rate next to the ratio so readers can compare.
Can the Sortino ratio be lower than the Sharpe ratio?
Yes. It happens when losses are larger than gains, for example in strategies that collect small premiums most months and take occasional large losses. That pattern is a warning sign worth checking.
The numbers above are on my Track Record page, updated every month. To see the trades behind them, one quarter at a time, watch Every Trade I Made.
Educational content only. Not investment advice. Past performance does not guarantee future results. See the Disclaimer.