Put Option Calculator
By Iskan Rakhmatov, independent options portfolio manager
Buying a put to profit from a decline or to hedge? Enter the strike, expiry, premium and your downside target. This put option calculator shows what the put is worth at your target. It also shows your profit, ROI and breakeven, and whether the target is realistic.
How a put option makes money
A put gives you the right to sell 100 shares at the strike price until expiry. You profit when the stock falls enough to cover the premium. Your loss is limited to that premium, unlike a short stock position.
- Breakeven at expiry: strike − premium
- Max loss: premium × 100 × contracts
- Max gain: strike − premium, if the stock goes to zero
How to calculate put option profit
At expiry, a buy put option profit calculator does three steps:
- Value per share: strike minus stock price, or zero if the stock is above the strike.
- Profit: (value minus premium) × 100 × contracts.
- ROI: profit divided by what you paid.
Before expiry, the put also has time value. The calculator adds it with the Black Scholes model, so you can see what the put is worth on your target date, not only at expiry.
Example
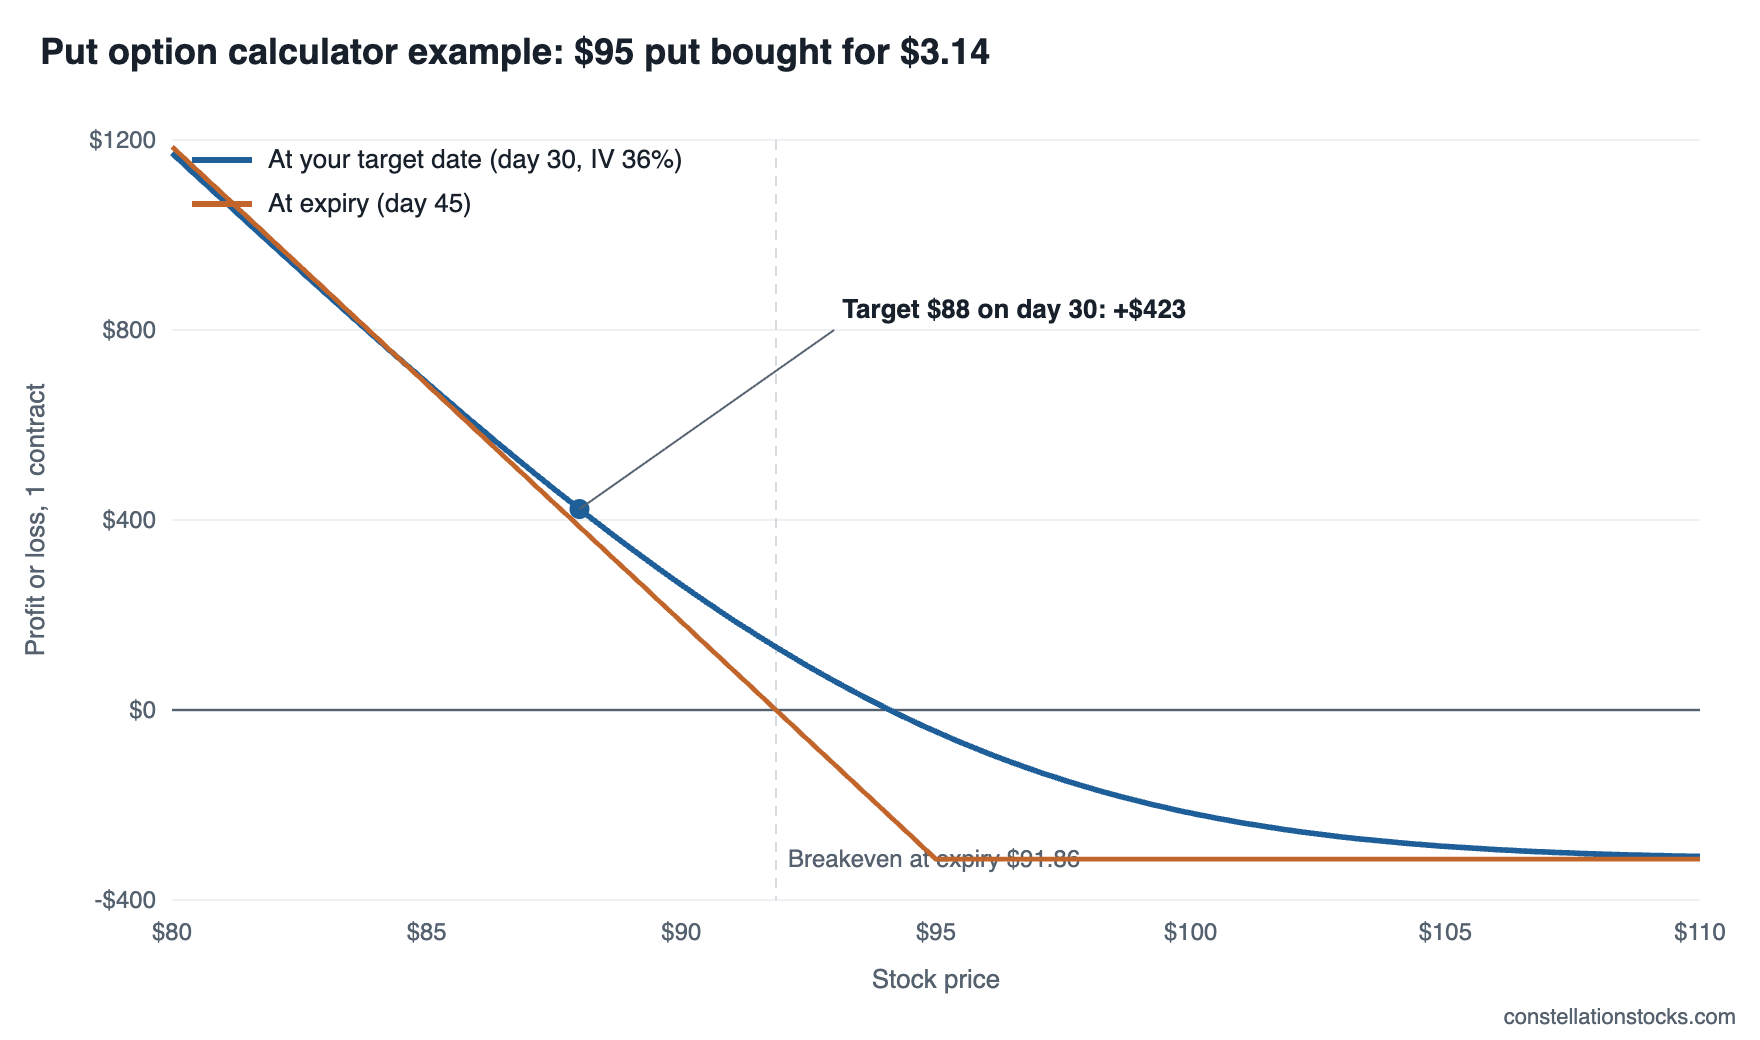
Stock at $100. You buy a $95 put expiring in 45 days, with implied volatility at 40%. Fair value is about $3.14, so one contract costs $314. Breakeven at expiry is $91.86.
Target: $88 in 30 days. If the stock gets there and implied volatility drops 10%, the put is worth about $7.37: a profit of about $423, or 135% ROI. Held to expiry at the same $88, the profit would be $386.
The target test says Stretch: a fall to $88 in 30 days is 1.11 standard deviations, with about a 27% chance of touching it. A bearish catalyst before the target date makes this trade much stronger.
Puts for shorts and for hedges
In my long/short book, puts do two jobs:
- Short ideas. A put expresses a bearish thesis on a business with risk capped at the premium. No borrow fees, no squeeze risk beyond what you paid.
- Hedges. An index put (I use IWM) protects a book of long positions in a sell off.
Implied volatility on puts often rises when stocks fall, so a put can gain from both the move and the volatility. Use the "IV change at target" field to model that, for example +10% instead of −10%.
For a cheaper bearish trade with capped profit, compare with the bear put spread calculator.
FAQ
What is the breakeven on a put option?
Strike minus the premium paid, at expiry. A $95 put bought for $3.14 breaks even at $91.86.
Is buying a put safer than shorting a stock?
The risk is defined: you can lose only the premium. A short stock position can lose without limit if the stock rises.
Why did my put lose value when the stock fell?
Time decay and falling implied volatility can offset part of the move, especially if the stock falls slowly or after an earnings report.
Does this put options calculator work for selling puts?
It is built for buying puts. For selling a put against cash, see covered call vs cash-secured put.
Other calculators
- Options profit calculator
- Black Scholes calculator
- Call option calculator
- Bull call spread calculator
- Bear put spread calculator
- Calendar spread calculator
- Diagonal spread calculator
See all of them on the free tools page.
Educational tool only. Not investment advice. Prices are Black Scholes estimates, not live quotes. See the Disclaimer.